Performance - Introduction
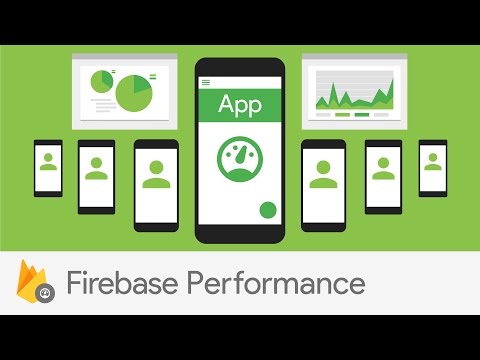
Gain insight into your app's performance issues
About
Firebase Performance Monitoring is a service that helps you to gain insight into the performance characteristics of your iOS and Android apps. You use the Performance Monitoring SDK to collect performance data from your app, and then review and analyze that data in the Firebase console. Performance Monitoring helps you to understand where and when the performance of your app can be improved so that you can use that information to fix performance issues.
Performance Monitoring is currently in beta release
https://firebase.google.com/docs/perf-mon/
Key capabilities
| RealAutomatically measure app startup time, HTTP/S network requests, and more | When you integrate the Performance Monitoring SDK into your iOS or Android app, you don't need to write any code before your app starts monitoring several critical aspects of app performance: startup time, activity while in the foreground, activity while in the background, and HTTP/S network requests. |
| Gain insight into situations where app performance could be improved | Optimizing the performance of your app can be challenging when you don't know exactly why it is falling short of user expectations. That's why Performance Monitoring lets you see performance metrics broken down by country, device, app version, and OS level. |
| Customize Performance Monitoring for your app | You can create traces to capture your app's performance in specific situations, like when you load a new screen. And, you can create counters to count events that you define (like cache hits) during those traces. |
How does it work?
Performance Monitoring is available for iOS and Android apps that include the Performance Monitoring SDK. Performance Monitoring monitors traces and HTTP/S network requests in your app.
A trace is a report of performance data captured between two points in time in your app. When installed, the Performance Monitoring SDK automatically provides app start traces, which measure the time between when the user opens the app and when the app is responsive. It also provides app in foreground traces and app in background traces to give you insight into how your app performs when in the foreground or when idle. To learn more about these types of traces, see Firebase Performance Monitoring Automatic Traces.
You can also configure custom traces. A custom trace is a report of performance data associated with some of the code in your app. You define the beginning and end of a custom trace using the APIs provided by the Performance Monitoring SDK. A custom trace can be further configured to record counters for performance-related events that occur within its scope. For example, you could create a counter for the number of cache hits and misses or the number of times that the UI becomes unresponsive for a noticeable period of time.
An HTTP/S network request is a report that captures the time between when your app issues a request to a service endpoint and when the response from that endpoint is complete. For any endpoint that your app makes a request to, the SDK will capture several metrics:
Response time: Time between when the request is made and when the response is fully received Payload size: Byte size of the network payload downloaded and uploaded by the app Success rate: Percentage of successful responses compared to total responses (to measure network or server failures)
User data
Performance Monitoring does not permanently store any personally identifiable information (such as names, email addresses, or phone numbers). While monitoring HTTP/S network requests, Performance Monitoring uses URLs (not including URL parameters) to build aggregated and anonymous URL patterns that are eventually persisted and shown in the Firebase console.
For a full list of data collected by Performance Monitoring, see Data collection.